Wednesday, December 8, 2010

Mapping the Census

This map shows the population of blacks accross continental United States. Looking at the map, it can be seen that Los Angeles county carries a huge majority of blacks. This is mostly due to the fact that Los Angeles has a big job market and many of the blacks migrate here for such opportunities. Areas in Michigan, Illinois and Florida also show a huge black population. The south in general has a lot of counties with high counts of blacks. This is mostly due to the fact that a part of American history ended up having them call that area home. But looking at this census map of 2000 and maybe comparing it with other census maps from before it will be easy to notice a trend interms of the movement of  blacks from the south to areas with more job opportunities. 


This map is meant to portray the Asian population in the continental USA. Looking at the map, it is easy to see that there is a similarity with the one above. The similarity is that Los Angeles also stands out with a very high Asian population. This could be credited to reasons such as California being the nearest mainland state to Asia, the aftermath of the Japanese Internment also the search for employment opportunities. In almost all the major cities in the United States, there is a China Town or a Korea Town. This goes to show how much the need for employment could cause a spread of a population.


This map depicts the population of whites in the continental United States. Like the other two maps above, Los Angeles stands out but not as the highest population density for whites. The map was replaced with that of people who identified themselves as some other race due to a  misunderstanding of the question in place. White populations over the years have dominated many places in America. Due to the high level of immigration, other races now claim the majority in many areas. Also, due to the fact that whites do not have as many kids as many of the other minority races, it can be seen that their majority is dying out in many places because there is the  production of less and less offspring as generations pass.


Looking at all three maps, it can be seen that California has a majority of almost all the populations. Many reasons can be given for this. This makes Los Angeles one of the most racially diversed counties in the world. Due to the fact that Los Angeles has a favorable weather, such can also be explained. It can be seen that large cities also have high populations of many of the races and like it has been explained above, economic reasons account for such a trend.


GIS is one of the coolest applications there is. Even though I haven't had a complete mastery of the software, I already find it useful and interesting. There is so much I learned from GIS that makes it unique. The labs and assignments in GIS were usually very difficult for me and sometimes frustrating but I'm pretty sure that with time, I will have a mastery of the software and I'm excited to be an expert.

Wednesday, November 24, 2010

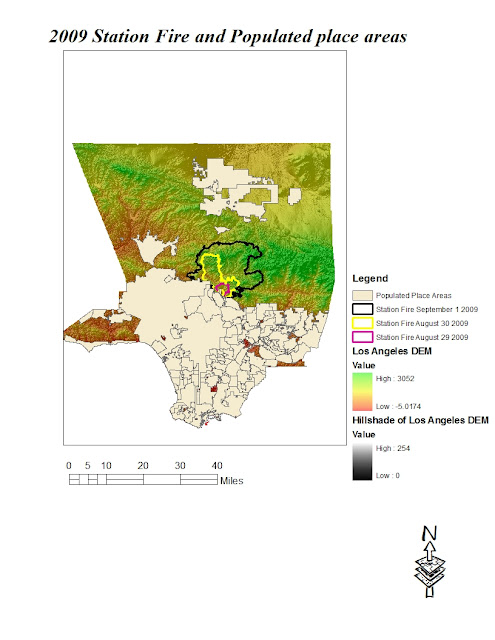
2009 Los Angeles County Station Fire in relation with populated place areas.


California is known for its wildfires. Because of this, every year, people do one or two things to make sure that they get prepared for the fires. The station fire of 2009 was one of the most devastating of wild fires in California. This fire was highly aided by California’s chaparral vegetation. According to inciweb.org, the station fire was the tenth largest fire in California since 1933 burning an area of 160,557 acres and the largest wild fire in the modern Los Angeles County, surpassing the 105,000 acre Clampitt Fire of September 1970. The station fire started on August 26th 2009 and lasted until October 16th 2009. A total of 209 structures were destroyed including 89 homes reported by inciweb.org. According to KTLA-TV, two firefighters were reported to be killed in the fire. The flames threatened a lot of structures in the Angeles National Forest and its nearby communities. These areas faced mandatory evacuation as the flames spread. According to officials, the station fire was started by arson.
According to inciweb.org, the predicted day for the station fires to be put out kept moving until the final extinction of the fire which occurred on October 16th 2009. It was very difficult to deal with the fire due to its enormosity. There were so many structures affected by the fire.  The fire spread northwards from its origin in the southern side of the Angeles National Forest. In the northward direction, the spread was over mountainous terrain containing denser vegetation. It took firefighters about two months to contain the fire. This is goes a long way to indicate that this fire was aggressive and therefore dangerous.

My map focuses on the fact that most of the populated areas in Los Angeles County were out of the fire path even though the origin seemed a little populated. Looking at my thematic map, it can be seen that the fire originated in the southern portion of the Angeles National Forest and spread in the northward direction. To the south of the fire's origin, areas of high population density can be seen. The fire was a devastating one and it is with a sigh of relief that the endangered areas had less people. This made evacuation plans easier and accomodation affordable. One of the things that can explain this is the fact that the atmospheric conditions of this time period highly favored the fire. During the period of the station fire, the atmospheric conditions were hot and windy. Winds carry flames faster along its path. The fact that Los Angeles only experienced about 9.08 inches of rainfall between July of 2008 and June of 2009 played a great role in the fast spread of the fire, as pointed out by laalmanac.com. With the little rainfall, the environment wasn't moist enough to resist the fire, hence its spark and rapid growth.

With the fire only causing 22 casualties but consuming an area of 160,557 acres, it can be seen that there were not so many people in the path of the fire. Had it been that the fire consumed any of the areas south of its origin, where the population is denser, the casualty rate would have been higher. According to lacanadaflintride.com, 500 homes had lost electricity by september 1st. Electric lines  carry flames fast and far. It will be devastating if this occured anywhere south of the fire's origin. It is also important to note that after wildfires, areas are vulnerable to mudslides. After the station fire, some of the areas were reported to have mudlides and debris flows during the first winter storms of the season. This was the case of Dunsmore Canyon which is one of the steep canyons that were affected by the fires. It experience a large amount of debris flow as reported by the USGS site. Such debris flows, mudslides and floods are usually due to exposion of the ground to running rain water due to the absence of plants. This flows are no joke because they can take out large populations and buildings. If the fire had consumed the highly populated areas of Los Angeles, the trouble would have been almost trippled.

All in all, it is important to look at the fact that due to Los Angeles' settlement pattern, the number of people affected by the fire wasn't large. It is a crucial thing to look at because even though a large amount of money had been spent to rebuild after the fire, much more would have been spent if the areas affected were any of the populated areas south of the fire's origin. This should be a sound warning for homeowners who in recent years have decided to move into sub-urban neighborhoods. The affected areas are all considered sub-urban and if people are actualy planning to move out to such places, they should be aware of the consequencies and disasters that come along.

CITATION

"Station Fire". inciweb.org.  Inciweb the incident information system: Station Fire. 11 Nov.
                  2009. 23 Nov.2010. http://www.inciweb.org/incident/1856/7.
"Station Fire Victims Sue Farmers Insurance". ktla.com.  Homeowners claim Farmers is refusing to pay for
                  smoke, ash and other damages to their homes. Aug 18 2010. 23 Nov 2010. <http://ktla.com/
                  news/landing/ktla-station-fire-farmers-insurance-lawsuit,0,5610248.story>
"Total Seasonal Rainfall (Precipitation) Los Angeles Civic Center, 1877-2009". laalmanac.com. Total
                 seasonal Rainfall 1877-Present. 2010. 23 Nov 2010. <http://
                 www.laalmanac.com/weather/we13.html>
"Station Fire". lacanadaflintridge.com. La Canada Flintridge. Sept 1 2009. 23 Nove 2010.
"2009 Station Fire Dunsmore Canyon Glendale California". usgs.gov. United States Geological Survey. April
           30 2010. Nov 23 2010. http://landslides.usgs.gov/monitoring/dunsmore

Monday, November 22, 2010

Digital Elevation Models


The area I selected is mostly Los Angeles. The reason why I selected this area is because Los Angeles is known mostly as a plain. As a geagrapgy student, I think it is important for me not to only hold to the fact that Los Angeles is flat. hence map assignment as such go a long way to help me clarify my doubts. I come from an area which is mostly mountains and now I live in an area which is mostly lowlying. With the help of a DEM, anyone can see that areas of highlands occur mostly north of Los Angeles' Central Business District (Downtown Los Angeles). Some information about the Gegraphic Cordinate system of the location can be that it is located in the GCS_North_American_1983 with the decimal degree extent as follows:
Top: 33.9447222213
Left: -118.446666666
Right: -118.035555555
Bottom: 33.7488888879.                                                                                                 

Tuesday, November 16, 2010

MAP PROJECTIONS

If we were to keep up with the believe that the earth was flat, conformal map prjextions such as the mercator and stereographic prjections shown above will go a long way to concretize that belief. However, it is not the case but this type of map projections helps to see the world in 2D as if it was laid down on a piece of paper for the common man. Maps like these are important because at almost the same proportion, we could look at the enttire earth all at once. On the other hannd, such a map could be misleading when it comes to the shape of the world.

The difficulty in viewing or seeing all the parts of the earth on a globe supports the fact that maps that are spherical such as the Equal Area maps shown above are a hard nut to crack in terms of seeing everything at once. Due to this, only half of the earth can be seen all at once and this might pose the problem of confusion to the map reader. The good thing about them though, is that unlike conformal maps, they give us the notion that the world is not flat. We can then look at the earth as a sphere, the same way it is in real life.

Very eye catching is the Equidistant map projection like the plate carree and conic projections above. Due to the fact that this type of map projection comes with so many different kinds of shapes, it makes it very interesting. Since such maps are very eye catching, it attracts viewers to them really quick. If it were a business, I would say that the profits would be large. The fact that they invite populations doesn't mean that they are easy to read. As a result, after a viewer has looked at the beauty and it comes to time for them to understand what it is all about, they get lost.


Map projections are very important for so many different reasons. In projecting maps, a lot of distortion is being done and this is very good because the different types of distortions can help in passing the different messages that they were intended to pass. As a result, maps are projected for different reraders to serve different purposes. Sometimes, projections are unacceptable. This is usually due to the fact that projections could alter the minds of the population and therefore influence anction which might end up negative.
Depending on what projections are needed for, they are very useful in everyday life and also harmful in certain cases.

Tuesday, November 2, 2010

ArcMap

While carrying out the ArcMap assignment, there were several things that hit my mind. I came to realize that the application wasn't as difficult to work with as I expected. Anyways, there were some pitfalls in the exercise that can be discussed; The exercise is time consuming. Even though it is relatively easy to do, it takes up so much time to complete it. Maybe a little more practice will make it seem shorter. Another pitfall of GIS is that some of the features are hard to understand. The aspects of geographical location is no problem to understand but for someone who has little or no knowledge in Geography, this tends to be cumbersome. Hopefully, in our class, there isn't anyone like that. Not only are the Geographical attributes a burden but the technological items are a load to digest. Also, the fact that the program is not accessible to everyone is an issue because there are so many things that individuals would love to do with GIS but since they can't get a hold of the software, they are doomed.

On the other hand, GIS is very important because in relatively less time than our forefathers, we can make maps of places which are as accurate as there can be. Another virtue of GIS is that there is much output with less work to do. This is so important because as days come and go, there is need for people to do so many things at given times. If all the time was given to map making, other things won't have been taken care of hence, with the speed and accuracy with which one is able to make a map using GIS, almost everything is taken care of.

GIS is als very useful because it is very important in emergency situations. By this I mean; in case of fire hazards, earthquakes and many more areas that require action can be mapped out using GIS as well as areas that are involved. GIS is also very useful in identifying distribution of so many different features on the earth's surface.

All in all, GIS is a very useful and growing program. Its uses are enormous and its application is simple. There is no time constraint and burden when using GIS. GIS is map-centric and focuses on mapping Geographical locations and features. Though there are a variety advantages to the apllication, the one most prolific disadvantage is that it tends to be a lot difficult to use.

Sunday, October 17, 2010

LAB 3: NEOGEOGRAPHY


View My Morning trip to UCLA in a larger map

When we look at Neogeography, many things can come to mind. There are many pitfalls as well as potentials and consequences of Neogeography. The pitfalls could include the fact that coordinates might not be accurately measured in terms of the features presented. Another pitfall is the fact that the individual is working with a map that has already been made by a company such as google and they are just superimposing points that they feel will help in creating a better understanding of their maps. The landforms and features that are marked could sometimes be due to the map maker's perception of the terrain and area which in many cases is very inaccurate.

Though there are pitfalls to neogeography, there are also some potentials which might include the fact that it creates a sense of direction in the mind of the maker while working on the mashup and on the mind of whoever is looking at it at a later time. It also helps the developer to remember certain landforms that are around the course marked. One very important thing about neogeography is that it helps in portraying human perception of their environment.

With neogeography possessing both pitfalls and potentials, there are consequences attached to it which include the fact that it could be misleading since we might be looking at markings that are performed from one's imagination of the spatial setting of a particular area. On the other hand though, it could be a great tool in making a simple sketch of a particular route, course, area, etc for the easy understanding of the reader or the public.

Tuesday, October 12, 2010

LAB 2: ANSWERS TO QUESTIONS

1. The name of the quadrangle is Beverly Hill, CA
2. The names of the adjacent quandrangles are:
       - Canoga Park
       - Van Nuys
       - Burbank
       - Topanga
       - Hollywood
       - Venice
       - Inglewood
3. The quadrangle was first created in 1995.
4. NAD 27 and NAD 83 were used as the horizontal datum for the quadrangle while the National Geodetic Vertical Datum of 1929 was used for the vertical datum.
5. The scale of the map is 1:24,000
6. a) 1/24000 = 5cm/x
       x = 5cm*24000 = 120000cm = 1200m.
       5cm on the map is equal to 1200 m on the ground.
    b) 1/24000 = 5inches/x
         x = 5inches*24000 =120000inches =  1.893 939 393 9 mile
         5 in on the map is equal to 1.9 mile on the ground.
    c) 1/24000 = x/1mile
         x = 63 360 inches/24000 = 2.64inches
         1 mile on ground is equal to 2.64 inches on the map.
    d) 1/24000 = x/3km
         x = 300000cm/24000 = 12.5cm
        3km on the ground is equal to 12.5cm on the map.
7. The contour interval for the map is 20 feet.
8. a)Geographic coordinates of the Public Affairs building: 34° 3' 55" N 118° 26' 10" W; 34.0653N 118.4361W.
    b) Geographic coordinates of the tip of Santa Monica Pier: 34° 00' 18" N 118° 29' 58" W; 34.005N 118.4994W.
     c) Geographic coordinates of the Upper Franklin Canyon Resevoir: 34° 07' 00" 118° 24' 30" W; 34.1167 N 118.4083 W.
9. a) Greystone Mansion is 580 feet (176.784 m) high
    b) Woodlawn Cemetry is 140 feet (42.672 meters)
    c) Crestwood Hills Park is 640 feet (195.057 meters)
10. The UTM zone of the map is zone 11.
11. The UTM coordinates for the lower left corner of the map: 3,764,000m and 362,000m.
12. 1,000 sq m x 1,000sq m = 100,000 sq m are contained within each cell (square) of the UTM gridlines.
13. Elevation Profile along UTM northing 3771000:
 
14. The Magnetic Declination of the map is +14°.
15. The direction of water flow in the intermittent stream between the 405 freeway and stone canyon is  south.
16.

Tuesday, September 28, 2010

I found this map on the google website. I obtained the image by typing in California in the search box and clicking on images. This is a county map of California. It shows all the different counties mapped out and colored to stand out. The county seats and important cities are not shown on the map, hence giving me the reason to find it interesting; to make my friends and family name the county seats of California. It is a map I have seen before in other Geography classes I have taken and I have been assigned once to draw a county map of California and I found it a little difficult. Now that I have a better idea of California than before, I now come to realize so many things I did not know about California counties.


This is the map of the Republic of Cameroon in Africa. I also found this map on the google website. There are many reasons that make this map not only interesting but unique. Many have argued about where this country is located in Africa. Some say it is in West Africa and others say it is in Central Africa. Given the location of the map, it usually depends on who is looking at it and also whose opinion. Many political views and activities have come into play in such a way that the location of this map is Geographically insignificant to the common man.

This is the map of the Fertile Crescent. It embodies three continents and  no ocean. This map, like the others, is obtained from google. The interesting feature of the map is the simple depiction of the area in which civilization is considered to have begun. One very trivial thing about the area colored pink is that there was a lot of migration along that area, be it animals or humans. Migration along this area brought about different influences that helped civilize the area. It is also around this same area where the main monotheistic religions came to being. The fact that this place is one of the most critical places of the old world as well as mordern time, it makes it interesting.

Three Interesting Maps

http://www.google.com/images?hl=en&expIds=17050,25657,26486,26488,26492,26494,26504,26751,26782,26809&sugexp=ldymls&tok=_qettCV53KXsrsORHwXFZA&xhr=t&q=california&cp=10&um=1&ie=UTF-8&source=og&sa=N&tab=wi&biw=1280&bih=841